



R.E.News International-Merlo/BiltData report shows $600b US construction growth by 2031
 27/08/26-FR-English-NL-footer
L’Amérique bâtit son prochain boom : 600 milliards de dollars en jeu
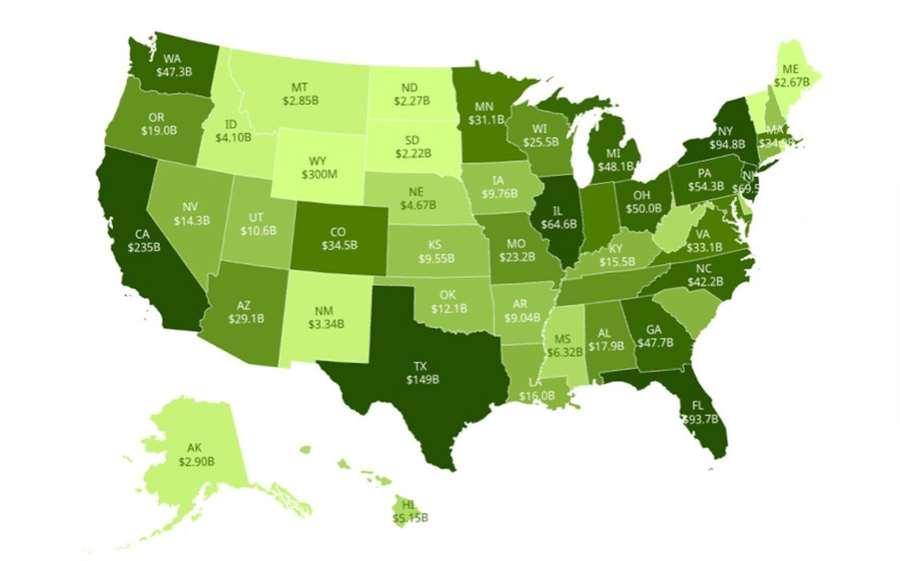 Data Centers Are Reshaping Construction Demand. (Image: Merlo).
L’Amérique n’a pas fini de construire. Elle s’apprête même à changer d’échelle.
Selon le nouveau rapport de Merlo America et BiltData.ai, les dépenses américaines de construction devraient passer de 2 220 milliards de dollars en 2026 à 2 850 milliards en 2031. En cinq ans, plus de 600 milliards de dollars supplémentaires pourraient ainsi entrer dans l’économie de la construction — l’équivalent, à eux seuls, d’un marché de la taille du Texas.
Mais cette croissance ne se diffusera pas uniformément. La Californie, le Texas, la Floride, New York et le New Jersey devraient concentrer environ 42 % des dépenses nationales. À eux seuls, les dix plus grands marchés métropolitains pèseront plus d’un tiers du total.
Au sommet, New York–Newark–Jersey City pourrait atteindre 230 milliards de dollars de dépenses d’ici 2031, soit près de 8 % du marché américain. Los Angeles, Chicago, Dallas-Fort Worth et Houston complètent le carré de tête.
Et derrière cette nouvelle carte de la construction se cache un moteur inattendu : l’intelligence artificielle.
La course à l’IA et au cloud transforme les data centers en nouvelles cathédrales industrielles. Les douze principaux marchés métropolitains devraient concentrer près de 73 % de la capacité américaine de data centers en 2031, alimentant une vague de terrassements, de bâtiments, de réseaux électriques et d’infrastructures.
Dallas-Fort Worth, Washington, Chicago et Phoenix figurent déjà parmi les territoires où cette révolution numérique devrait se traduire par davantage de chantiers — et davantage de machines.
Pour les fabricants, concessionnaires, loueurs et entrepreneurs, le véritable enjeu n’est donc plus seulement de savoir combien l’Amérique va construire, mais où elle construira demain.
Même l’Amérique rurale conserve une place dans cette nouvelle géographie. L’agriculture continue de soutenir une importante économie d’équipements, tandis que les prévisions 2031 font apparaître 1 026 milliards de dollars dans le résidentiel, 741 milliards dans le commercial, 684 milliards dans l’industriel et 399 milliards dans les infrastructures.
Le message du rapport est finalement simple : la prochaine croissance ne se gagnera pas en réagissant au marché, mais en arrivant avant lui.
Car lorsque les premiers engins entrent sur le chantier, la véritable décision — celle de savoir où investir, quelles machines positionner et quelles agences développer — a souvent déjà été prise des années auparavant.
NJC.© Info Merlo America and BiltData.ai, U.S.
---------------------------------------------------------------------------------------------------------------
27/08/26-English
America is building its next boom: $600 billion at stake
Data Centers Are Reshaping Construction Demand. (Image: Merlo).
America isn't done building. It's even about to change scale.
According to a new report by Merlo America and BiltData.ai, U.S. construction spending is projected to increase from $2.22 trillion in 2026 to $2.85 trillion in 2031. In five years, more than $600 billion more could enter the construction economy—the equivalent of a market the size of Texas.
But this growth won't be evenly distributed. California, Texas, Florida, New York, and New Jersey are expected to account for about 42% of national spending. The ten largest metropolitan markets alone will represent more than a third of the total.
At the top, New York–Newark–Jersey City could see $230 billion in spending by 2031, representing nearly 8% of the U.S. market. Los Angeles, Chicago, Dallas-Fort Worth, and Houston round out the top four.
And behind this new construction map lies an unexpected driver: artificial intelligence.
The race for AI and cloud computing is transforming data centers into new industrial cathedrals. The twelve largest metropolitan markets are expected to concentrate nearly 73% of U.S. data center capacity by 2031, fueling a wave of construction, buildings, power grids, and infrastructure.
Dallas-Fort Worth, Washington, D.C., Chicago, and Phoenix are already among the areas where this digital revolution is expected to translate into more construction sites—and more machines.
For manufacturers, dealers, lessors, and contractors, the real question is no longer just how much America will build, but where it will build tomorrow.
Even rural America retains a place in this new geography. Agriculture continues to support a significant equipment economy, while 2031 projections show $1.026 trillion in residential construction, $741 billion in commercial construction, $684 billion in industrial construction, and $399 billion in infrastructure.
The report’s message is ultimately simple: the next growth will not be achieved by reacting to the market, but by getting ahead of it.
Because when the first machines arrive on the construction site, the real decision—where to invest, which machines to position, and which agencies to develop—has often already been made years earlier.
NJC.© Info Merlo America and BiltData.ai, U.S.
----------------------------------------------------------------------------------------------------------------
27/08/26-NL
Amerika bouwt aan zijn volgende bloeiperiode: 600 miljard dollar op het spel
Data Centers Are Reshaping Construction Demand. (Image: Merlo).
Amerika is nog lang niet klaar met bouwen. Sterker nog, de schaal ervan zal veranderen.
Volgens een nieuw rapport van Merlo America en BiltData.ai zal de Amerikaanse bouwsector naar verwachting groeien van 2,22 biljoen dollar in 2026 tot 2,85 biljoen dollar in 2031. In vijf jaar tijd zou er meer dan 600 miljard dollar extra in de bouwsector kunnen stromen – een markt zo groot als Texas.
Maar deze groei zal niet gelijkmatig verdeeld zijn. Californië, Texas, Florida, New York en New Jersey zullen naar verwachting samen goed zijn voor ongeveer 42% van de nationale uitgaven. De tien grootste metropolen alleen al zullen meer dan een derde van het totaal vertegenwoordigen.
Aan de top zou New York-Newark-Jersey City in 2031 230 miljard dollar aan uitgaven kunnen genereren, wat neerkomt op bijna 8% van de Amerikaanse markt. Los Angeles, Chicago, Dallas-Fort Worth en Houston completeren de top vier.
En achter deze nieuwe bouwkaart schuilt een onverwachte drijfveer: kunstmatige intelligentie.
De race om AI en cloudcomputing transformeert datacenters in nieuwe industriële kathedralen. De twaalf grootste metropolen zullen naar verwachting in 2031 bijna 73% van de Amerikaanse datacentercapaciteit concentreren, wat een golf van bouwprojecten, gebouwen, elektriciteitsnetten en infrastructuur zal aanwakkeren.
Dallas-Fort Worth, Washington D.C., Chicago en Phoenix behoren al tot de gebieden waar deze digitale revolutie naar verwachting zal leiden tot meer bouwplaatsen – en meer machines.
Voor fabrikanten, dealers, verhuurders en aannemers is de vraag niet langer alleen hoeveel Amerika zal bouwen, maar waar het morgen zal bouwen.
Zelfs het platteland van Amerika behoudt een plaats in deze nieuwe geografie. De landbouwsector blijft een belangrijke motor voor de machinebouw, terwijl de prognoses voor 2031 een waarde van $1,026 biljoen in woningbouw, $741 miljard in commerciële bouw, $684 miljard in industriële bouw en $399 miljard in infrastructuur laten zien.
De boodschap van het rapport is uiteindelijk eenvoudig: de volgende groei zal niet worden bereikt door te reageren op de markt, maar door er op vooruit te lopen.
Want wanneer de eerste machines op de bouwplaats arriveren, is de werkelijke beslissing – waar te investeren, welke machines te plaatsen en welke instanties te ontwikkelen – vaak al jaren eerder genomen.
NJC.© Info Merlo America en BiltData.ai, VS.
--------------------------------------------------------------------------------------------------------------
Date de dernière mise à jour : 26/08/2026